Deep dive into Power BI: user ID or user group-based pages
Innofactor's deep-dive blogs provide in-depth insights into various Microsoft technologies, including Azure, Dynamics, Power BI, and Data Platforms. Written by our talented professionals, these articles are designed to help you discover new tips and tricks.
User Id or User Group based pages in Power BI report UI
Our target is to make one report that has different pages to users depending on which AD groups they belong to.
Alternative implementation methods
Our requirement is simple and basic, but Power BI doesn’t support this type of solutions, so the solution described here is quite complex.
But before going to our solution, let’s consider first what mechanisms there are available for doing this. Here is the list from worst to best:
1. Using graph functionality
With URL https://graph.microsoft.com/v1.0/groups/{YourAdSecurityGroup}/members, it is possible to query members of an AD group.
This solution has a few weak points:
- You can’t give graph access permissions to Power BI application. So you need to create an artificial Azure application on top of the Power BI report to grant access to the report to use graph features.
- There is no mapping between role / user / group < -- > Pages or bookmarks, so you can’t deny roles from using certain pages or to force them to use it.
2. There is an integration to AD in beta phase (2021-06) which perhaps fixes first one of those issues. But the second issue remains,
3. Using row-level based security
Most of security experts say that only row level-based security is a safe mechanism to implement differing access permissions to different groups.
But it has its weaknesses:
- You can’t remove functionalities, such as the whole table, from users to whom it is always empty. You can make a function on its background color to change depending on if it is empty or not.
- It is cumbersome to implement: if you decide that the report can’t show employee’s salary, then by default, the report won’t show any statistics that uses the salary information. It is possible to create summary tables for statistics, but the extra work can be too much and it will also make the solution more complex.
4. Two applications
Simplest solution is to write a separate report for every role.
This has its drawbacks as well:
- You should use golden dataset style to avoid wasting memory: https://www.coatesdatastrategies.com/blog/5-tips-for-separating-power-bi-datasets-and-reports
- This is work intensive and error prone
5. Combining button Page navigation programming feature with role-based security
These two should really have nothing to do with each other, but with the lack of options, we will do this exactly.
Here are instructions that we used to implement this: https://www.solution-tailor.com/post/powerbi-tab-level-security
Since this solution only changes buttons, you could assume that it is not safe: if you send link to private pages to person who has access to public pages, there is nothing to prevent them seeing the private content. But Microsoft has done good work in here: I don’t know how they did it, but this solution is safe, that scenario didn’t work when we tested it on our home page solution.
Reason why there are so many limitations to this technology are coming from the security side.
Prerequisites
You need to design your report to have either
- A home page with links to every page. Hide all other pages and make a hardcoded back button to the home page.
- A page navigator bar.
With either case, you need to use page navigation. This solution doesn’t work for bookmarks (2021-06).
Implementation steps
1) Rename your pages to official page names you will later on have as buttons.
2) Write your page names to an Excel:

- This mechanism works with more than two roles as well.
- You can deny some pages altogether (Expenses) and you can make pages identical (Management).
- Pages which are different for at least one role need to have unique names: Sales and Sales (private).
- Save the Excel as-is to SharePoint, on-site Power BI server, or if you don’t have other options, on your laptop.
3) Create duplicates of the pages you need to have two versions (Sales) and do the needed changes.
4) Open Power Query Editor in Power BI Desktop, select New Source -- > Excel -- > Select the File -- > Open -- > Select Table1 -- > OK
5) Rename Table1 as RolePermissions.
6) Close & Apply
7) Create roles “Private” and “Public” with DAX Studio or from menu Modelling -- > Manage roles.
8) Write DAX code [Role] = "Private" and [Role] = "Public" for table RolePermissions.
9) Save and Publish your project.
10) Go to Azure or Power BI service and select three dots for the dataset:

11) Select Security (don’t mix Security and Manage permissions with each other).
12) Add users and/or groups to both roles. If user doesn’t have permissions to either role, then he will get an error.
13) Create your buttons. There are two alternatives for that. Hard-coded buttons:
a. Create page buttons on home page or on every page.
We opted to show all buttons to both roles.
Shared buttons point to different pages depending on the role.
Then for buttons that are only to one of the groups, you can program them to give an error by pointing them to non-existing page, such as “Foobar”. Or you can program them to do nothing, by leaving the page name empty for the role as I did on this example.
b. Enable Action, set Type as Page navigation and make a function on Destination which points to the correct page (here Budget and costs):
c. The summarization value affects only on admins and people who are added to both/all roles, so decide if they should get first or last value.
d. Create Home or Back button on each page. I recommend for you to hardcode it to the home page.
14) OR create automated two-button solution. So the first button will only change where the second button will be linked to.
a. Make a second sheet to our Excel with columns Page and Order.
b. Copy-paste page names from both private and public rows using Transpose.
c. Add sorting numbers to the column Order.
d. (Optional: Add an empty page with sorting number 999. This is needed on rarer cases because when you program this, you need to set one page as the default selection.)
e. Create a new import for the table 2 and rename it as Navigation.
f. Filter out empty rows.
We had extra pages, bookmarks, and decided to add these to the Excel, but without sorting number, and then to filter these out at this point.
g. Write measures for the button text and button actions:
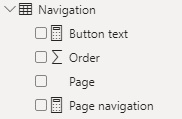
h. Button text:
Button text = "Click to go to " & [Page navigation]
i. Button action:
Page navigation = SELECTEDVALUE(Navigation[Page])
j. Create somewhere the only functional button. Set Button text as its text, and as the tooltip.
k. Set button action as Page navigation with this destination:
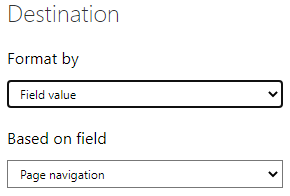
l. Create slicer and set Page as its field:
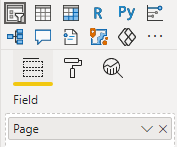
m. Change slicer as single select and horizontal to make the list to look like buttons.
n. Set relationship between roles of RolePermissions and Navigation:
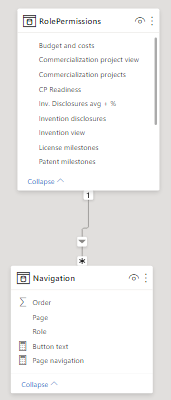
o. Now when you press from the slider, it does nothing except changes the second button text. And you need to press the second button again.
p. Administrators will see all buttons. You can assign testers to both roles as well. And then rest of the users will see either public or private buttons.
15) Test
a. Press F5 to refresh the page!
16) You can verify the security situation by sending an URLs to private page and to shared page to a person with public access. Admins can’t test this.
Timo works at Innofactor as a Data Analyst. In the past he has been a Solution Architect at Nokia and worked as an MS SQL expert.


