Data-driven decision-making can provide benefits such as the identification of new competitive advantages and improved sales, which is why it is implemented by many organizations today.
At a practical level, data-driven decision-making is based on using business reports and other reports in organizational decision-making. In the long run, however, this increases reporting needs and the number of reports, which often makes the management of reporting very challenging. Nevertheless, all organizations should be able to answer at least the following questions concerning reporting:
- Are we able to make optimal use of the reports available to us?
- To what extent are reports used?
- Do specific groups of users make use of the reports specified for them?
- How do we ensure that our organization’s experts have started to use Power BI?
Innofactor has created Power BI Activity Report (PAR) as a new tool for the monitoring of Power BI reports because the Microsoft product offering does not include a solution that answers the above questions, or other key questions related to reporting. In this article, I present the key benefits of our PAR tool and seven Power BI reporting challenges that can be solved with the help of the tool.
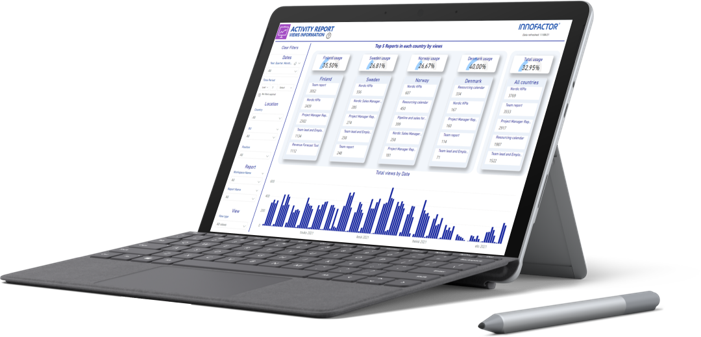
Power BI Activity Report gathers data on the use of Power BI and presents it in a single report. The data shown in the report helps organizations increase their efficiency and reduce their experts’ workload.
How does Power BI Activity Report work and what are its benefits?
The PAR tool collects activity data on the use of all of the Power BI reports in an organization’s Office 365 tenant and summarizes the data in a single report for easy viewing. The PAR solution also creates a history on the data it collects to enable the analysis of user data over a longer period.
The PAR tool enables you to visualize data on your organization’s report usage from the following perspectives, among others:
- Report usage at the level of the entire organization and disaggregated by business unit.
- Tenant status: the number of reports, data sets and users and the volume of activity.
- The most frequently used reports and related top-level activities.
- Unused reports: the tool identifies reports that have been used minimally or not at all, and provides additional information about them.
- User data: the most active users and each event itemized by user.
"Activity data on the use of reports makes it possible to identify problematic issues and help experts make better use of the reports created for their needs, thereby increasing their productivity."
Activity data on the use of reports is highly valuable, as it makes it possible to identify problematic issues and help experts make better use of the reports created for their needs, thereby increasing their productivity.
Based on my own experiences and observations, I have identified seven concrete Power BI reporting challenges that can be solved with the help of the PAR tool and the analysis of report data:
- The report has been published, but no-one is making use of it. → Define a primary user group for the report (for example, sales personnel) and inform the members of the group about the report.
- The intended primary users of the report are not making use of the report for some reason. → Ensure that the intended primary users know how to use the report correctly and understand what benefits the report offers.
- The report is used by a person who should not have access to it. → Ensure that access rights are granted to the correct users.
- There are many unused reports in the tenant that take up capacity. → Remove unnecessary reports.
- A user has downloaded report data on their own computer. → Get in touch with the person directly to determine whether there is a valid reason for this.
- The business does not recognize the value of the reports. → Activity data on report usage can be used to calculate the reports’ return on investment.
- Power BI Premium capacity is in use, but the organization is experiencing difficulties with capacity management. → Activity data on report usage can be used to monitor capacity utilization, and future usage needs can be anticipated by means of a test environment, for example.
Depending on the organization and its industry, examining activity data on report usage can also provide other benefits besides the ones mentioned above. The PAR solution allows you to comprehensively examine your workplace’s Power BI usage and focus IT resources in a way that significantly increases your organization’s productivity.
Visit our website to browse our analytics-related offering and learn more about solving business challenges with the help of real-time data and analysis solutions! You can also contact our experts directly to discuss the PAR solution in more detail.


